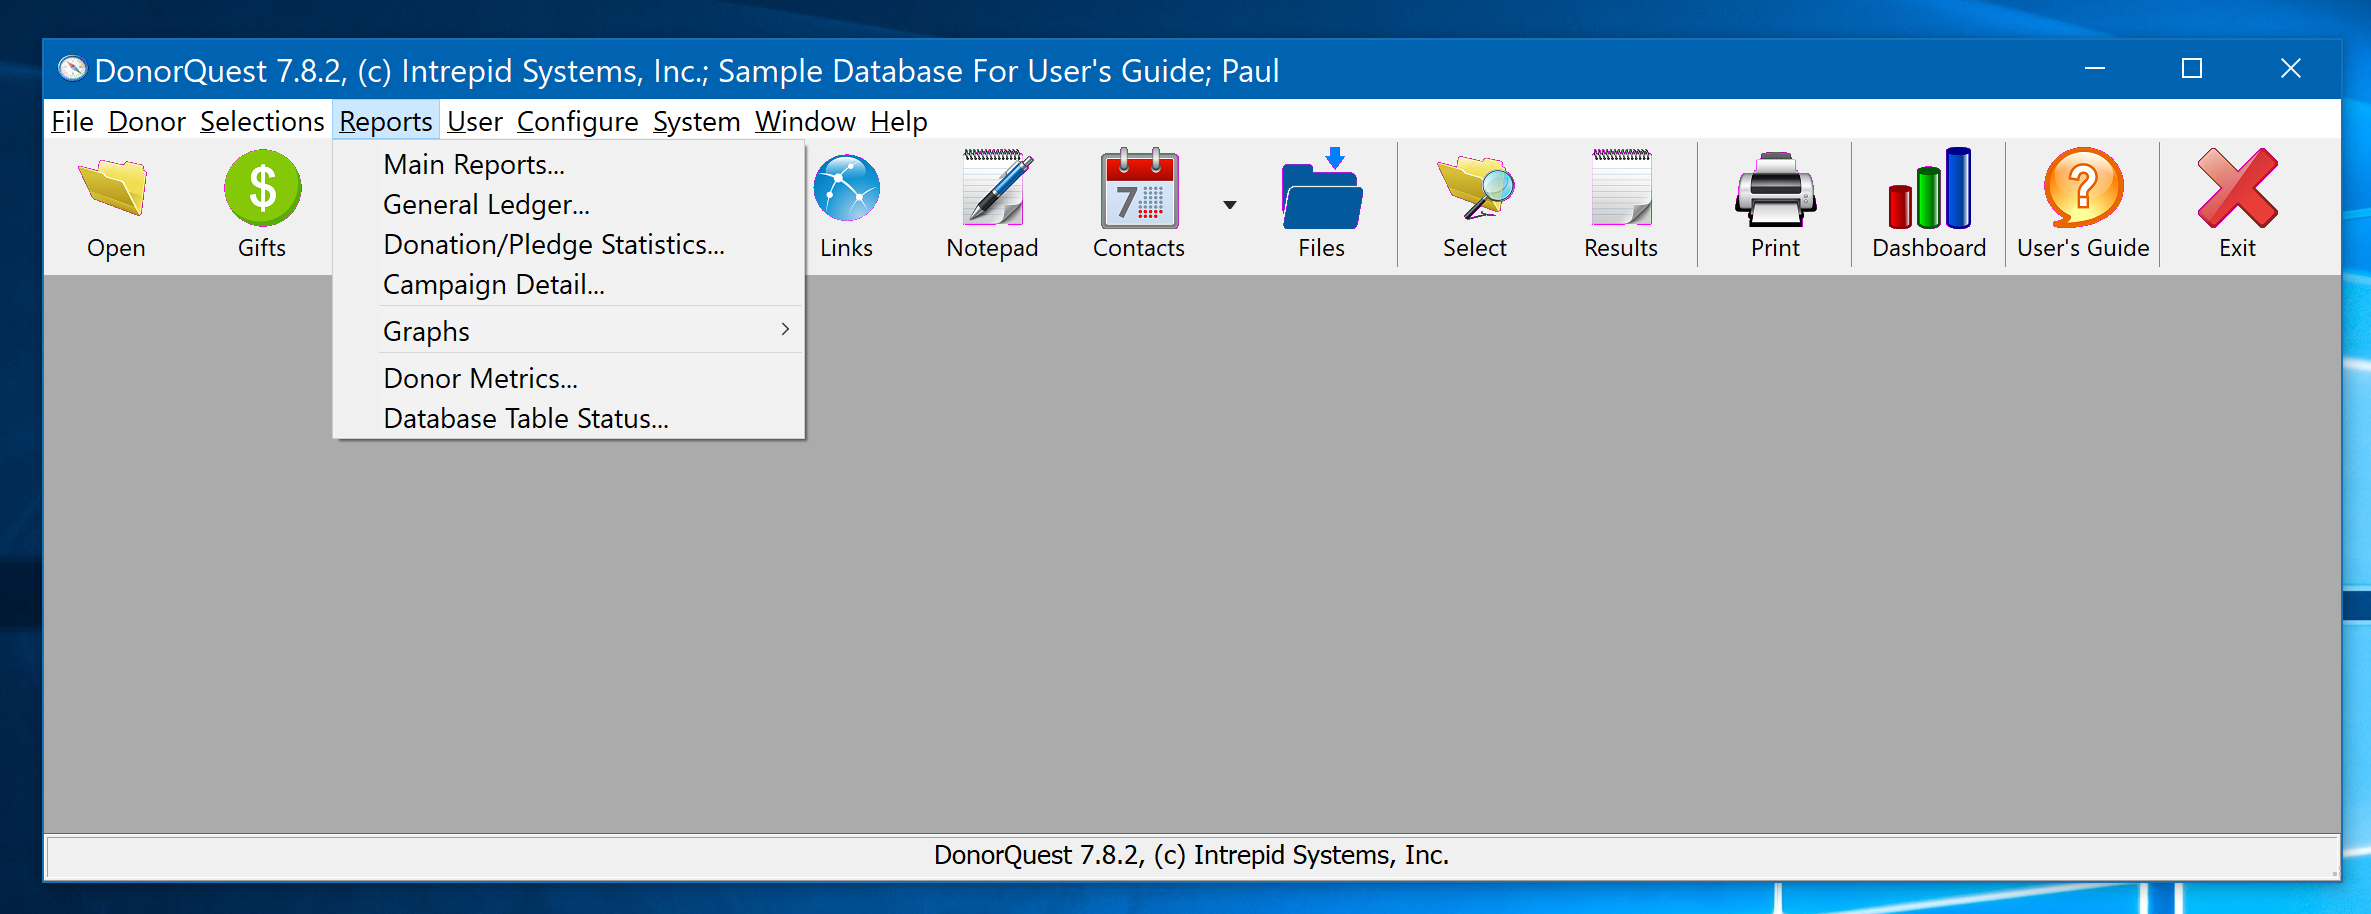
The Reports Menu is the central access point for all reports in DonorQuest.
Main Reports
The Main Reports option will close all open windows and active the standard DonorQuest reports menu containing the over 400 standard DonorQuest reports, but it will do so directly, allowing each report to be run outside of a Selection filter, and independently of any records you may have marked in the Main Information window. Both the tool bar Print icon and the File, Print/Setup A Report menu will always defer to any highlighted Selection Result or Main Information record, effectively filtering the output of any report you then select from the report menu.
General Ledger
Launches the General Ledger Process which prints an optional deposit report for donation batches, and also generates the Word mail merge files used for thank-you letters.
Donation / Pledge Statistics
DonorQuest gathers statistics for Donations and Pledges. Specifically, it focuses on the Donation/Pledge Type, Account, Stimulus, Fund, and Appeal fields. This option will allow you to view and print these statistics.
Campaign Detail
Campaign Detail can be viewed for donation and pledge totals or for specific campaigns (stimulus codes). This option will allow you to view and print this detail.
Graphs, Constituent Counts
This simple graph shows you a count of constituent acquisitions over time. You may also use it with a Selection Result to filter the constituents being counted.
Graphs, Donation Graphs
Donation Graphs are designed to give you the big picture of how your organization has been doing over time in terms of actual revenue.
Graphs, Pledge Graphs
Pledge Graphs are similar to Donation Graphs, but instead show you things such as total pledged, total paid, combined remaining balance, etc.
Graphs, Memo Graphs
Memo Graphs will show you a count of memos added by years, months, day, and weeks. Additional filters are available for showing specific quarters or months.
Graphs, Scheduled Contact Graphs
Contact Graphs will show you a count or grant amount totals of contacts by years, months, day, and weeks. Additional filters are available for showing specific quarters or months. You may also chose the target date being graphed across time to be Last Contact, Next Contact, Date Grant Request Made, Date Request Acknowledged, Date Decision Made, Date of First Payment, and Date Grant Added. Target amount field may be set to Amount Requested, Amount Granted, Difference, Total Paid, Balance Remaining for a grant, etc.
Graphs, Donor Retention Graphs
Donor Retention Graphs will show you for each year, what percentage of the donors who gave also gave in the previous year. Time interval may also be set to months. When viewing by years, a filter may be set for specific quarters and months of each year.
Donor Metrics Reports
The Donor Metrics series of reports essentially allow you to compare statistical changes in donor giving behavior between multiple time periods. The metrics shown are Total Number of Donors, Number of New Donors, Number of Repeat Donors, Total Number of Donations, Dollar Total of Donations, Average Donation Amount, and Average Number of Gifts Per Donor. In addition to these metrics being shown in total for each period, the same metrics are also shown broken down by multiple donation amount ranges. All aspects of the report are customizable, including the specific time periods compared, and the specific donation amount ranges shown. Due to the large number of columns on these reports, they go well beyond what can easily be displayed on paper or in a PDF document format. Therefore they are viewed in a spreadsheet-style data grid, and can only be output to file or Excel.
Database Table Status
The Database Table Status gives you a quick overview of the number of records in the various DonorQuest data tables.