Reports, Graphs
DonorQuest includes many graphs to help you visualize your data. You can graph counts of new Constituent and Memo additions over time, plus detailed count and dollar total information for Donations, Pledges, and the grant metrics of Contacts. These graphs are available both on the Reports menu, and when the Selection Results window is open. If you wish the graphs to operate on all Constituents, Memos, Donations, Pledges, and Contacts, then launch them from the Reports menu. However, if you wish to graph only the records of a particular Selection Result, start by opening the Selection Results window, highlight the selection you wish to graph, then click the Graph button you will see on the left side of the Selection Results window. The graphs are particularly flexible when used with a Selection Result, as this allows you to apply any conceivable filter condition to the data being graphed. For example, you could graph just the donations for a specific campaign by first running a selection to capture those specific donations.
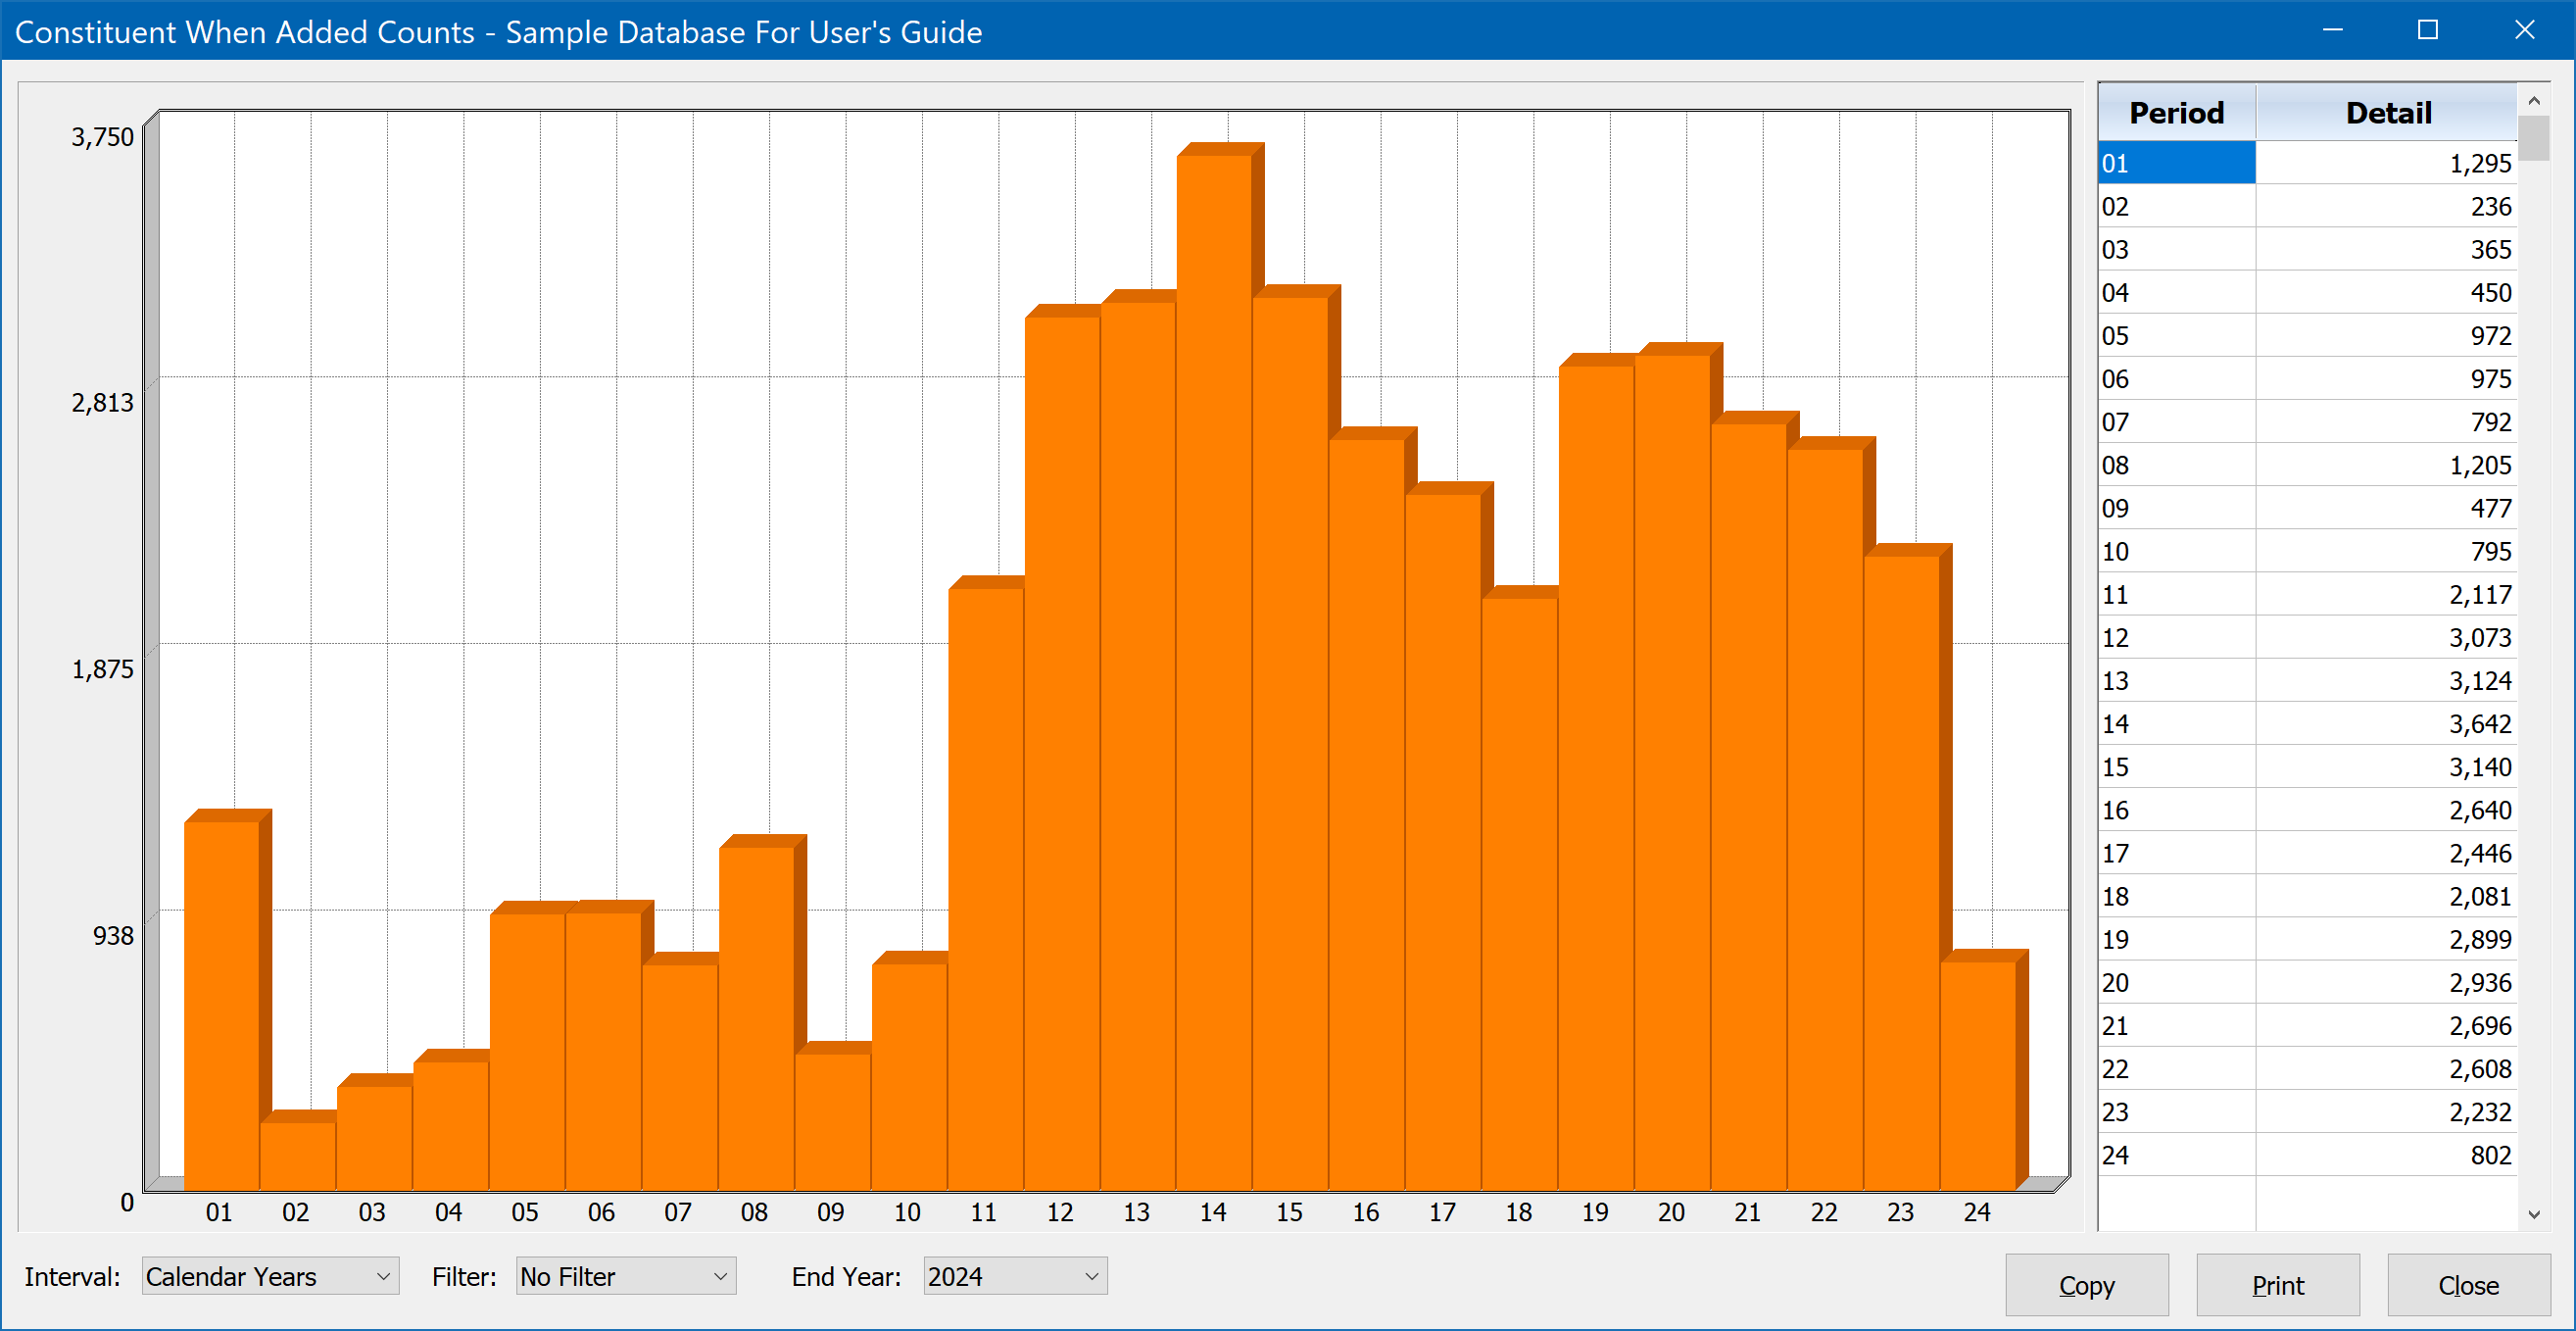
Counts in graphs are shown in amber, and dollar totals in green. Some graphs, like the Constituency Counts graph (shown below), can only display counts, so the bars are always amber. Other graphs (such as the Donations graph) have a checkbox for toggling between totals (shown in green), and counts. Each graph also contains two display components - the actual graph, and a grid with the raw numbers from which the graph is drawn.
All graphs provide interactive controls which allow you to customize the graph content for specific time spans and intervals within each time span. You can also apply some basic interactive filters to the data, whether or not you are graphing data from a selection result. While some graphs have controls which are specific to them, all graphs will have Interval, Filter, and End Year options. All graphs will also have Copy and Print buttons. The Copy button will copy the graph to your computer's clipboard, so that you may paste it into a document. The Print button will simply print the graph to the printer you choose.
Constituent Counts
Choosing Reports, Graphs, Constituent Counts will display the Constituent Counts graph. This graph simply counts the number of new constituents added to your database at specific time intervals. Here's what this graph would look like for a typical nonprofit organization adding a few thousands constituents per year:
Interval
The default interval for the Constituent Counts graph is calendar years, spanning 24 years, ending in the current calendar year (shown above). Clicking on the drop-down list for the Interval control will reveal the other intervals available, specifically Fiscal Years, Months, Weeks, and Days. Note that the fiscal years displayed are based on the fiscal year settings you have specified for your organization under Configure, Program Settings. Be sure the correct starting month and current fiscal year are set there.
Filter
By default there is no filter applied to the data in the graph. Clicking on the drop-down list for the Filter control will reveal all available filters, which include Year-To-Date, specific Quarters, or a particular Month. These filters are only available when the Interval is set to calendar or fiscal years. The Year-To-Date filter will include only data which was added up to the current point in time for each year. For example, if today is March 15th, then all years will be filtered such that only data between the start of each year and March 15th of each year is shown. Likewise, choosing a specific quarter (1..4) from the drop-down list for the filter control will allow you to see only data from each year for the specific quarter chosen. This allows you to compare a specific quarter across all the years shown. Lastly, choosing a specific month from the drop-down list for the filter control will allow you to compare data from a specific month across the years.
End Year
By default the end year for each graph when you first open it is the current year. This allows you to see back 24 years. However, you may go back even further in time if need be by setting an ending year which is further in the past. If the Interval is set to months, this setting becomes more important as only the past 24 months are shown from a specific ending year, and you may wish you review 24-month spans further back in time.
End Date
While the End Date control is not displayed initially, the End Year control will magically change to be an Ending Date if the Interval is set to Weeks or Days. This allows you to set a specific end point for a week or day graph, down to an exact day.
Donation Graphs
Choosing Reports, Graphs, Donation Graphs will open with the standard year-based Donation revenue graph, which looks like this:
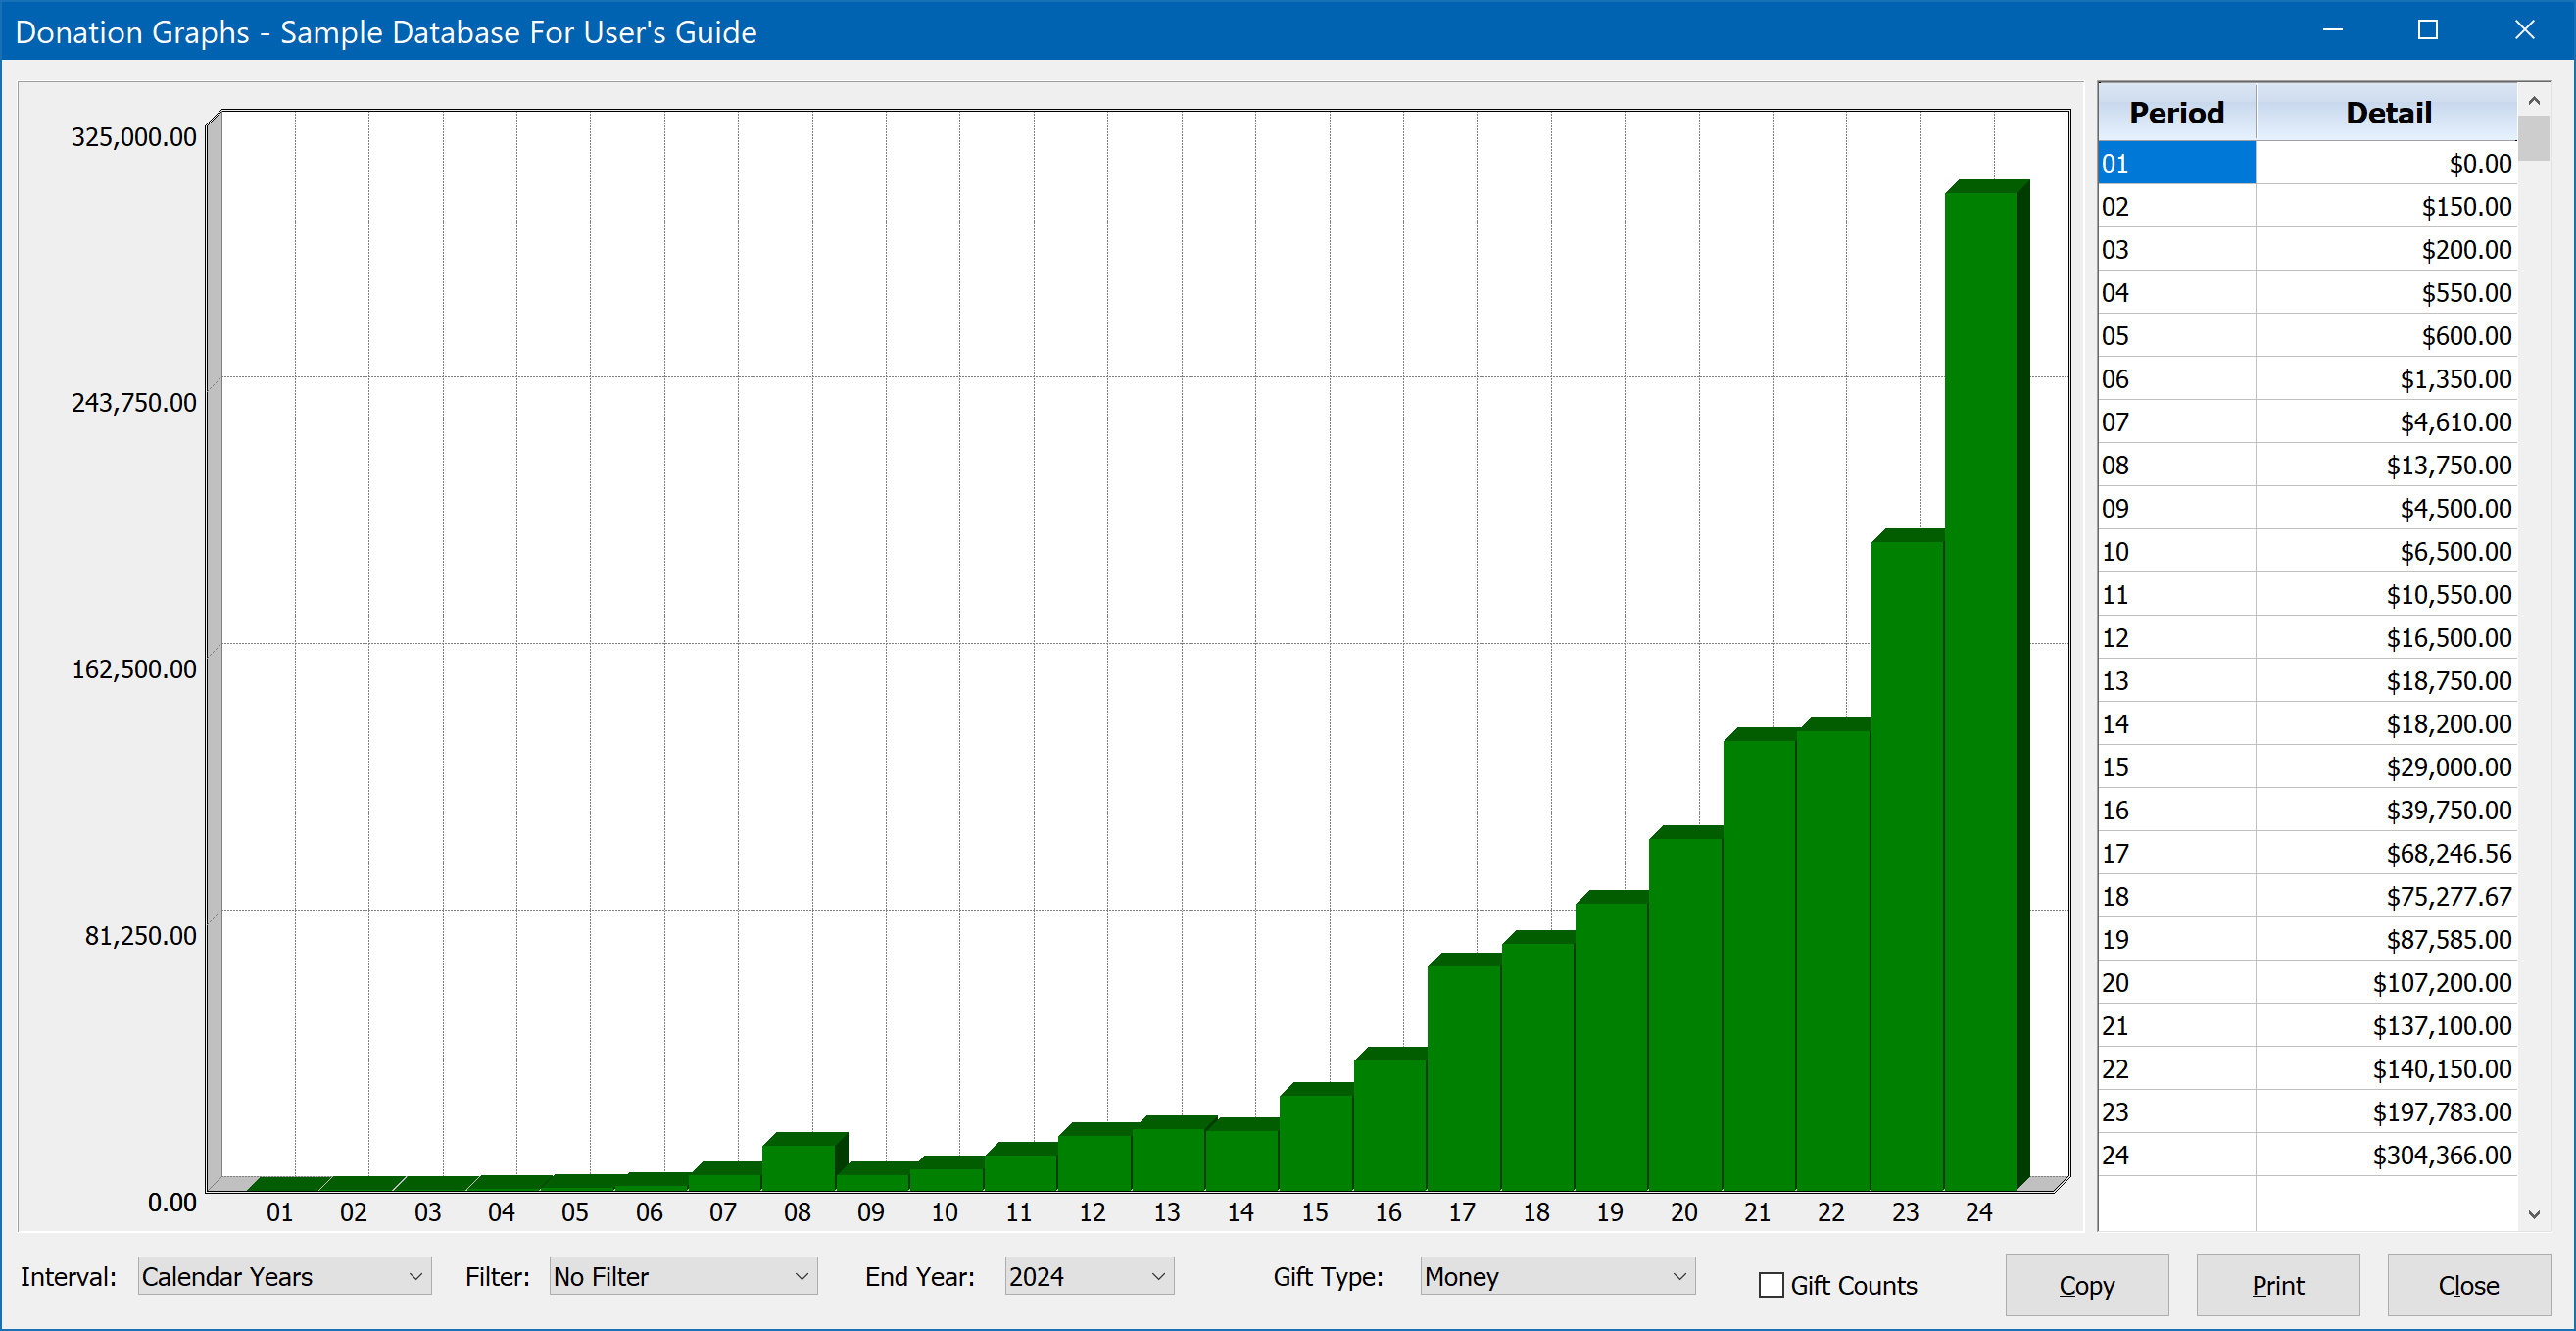
As with all graphs, the Donation Graphs provide Interval, Filter, and End Year / End Date controls (described above). When first opened, the graph will show the default display of a 24-year time span, with total revenue broken down by calendar years. You can change the interval to be fiscal years, months, weeks, or days. When viewing a year or month interval, the ending year of the graph may be set to any year you wish. For example, if you set the ending year to 2008, and keep the interval at calendar years, the graph would cover the years 1984-2008. If the interval is set to weeks or days, you can set an exact ending date.
The donation graphs may also be driven by a donation-based selection result. This allows you to filter the donations included by any conceivable condition or set of conditions. To graph a donation-based selection result (one built from the donations table), open the Selection Results window, highlight the donation result you wish to graph, then click on Selections, Donation Graphs From. Alternatively you may also simply click on the Graph button on the left side of the Selection Results window.
Gift Type
In addition to monetary totals, using the Gift Type control you may also choose from any Alternate Unit donation types your organization may have created. Alternate Unit donations are non-monetary. Typical Alternate Unit types of donations would include hours of time for volunteers, pounds of food, etc. New Alternate Unit types can be defined as needed under Configure, Program Settings.
Gift Counts
Finally, you also have the option of graphing gift counts instead of amount totals. This is done by checking the box labeled, "Gift Counts." You may toggle back and forth between the gift total and gift count graphs to see the relationship between the two. This can be very revealing. For example, you may find that in some years, while the total revenue was about the same, one year saw a much larger number of gifts going into making the total. That will tell you that for that year, your campaign efforts may have brought in more gifts, but not really anymore revenue. So you would then want to review the campaigns you ran in the lower gift count (but equal revenue) years. Since the revenue was the same, that will tell you that the campaigning for the lower gift count year was actually reaching more affluent donors, and perhaps you should refocus your efforts there again, since a gift count boost there would be far more valuable.
Pledge Graphs
Choosing Reports, Graphs, Pledge Graphs will open with the standard year-based Pledged amounts graph, which looks like this:
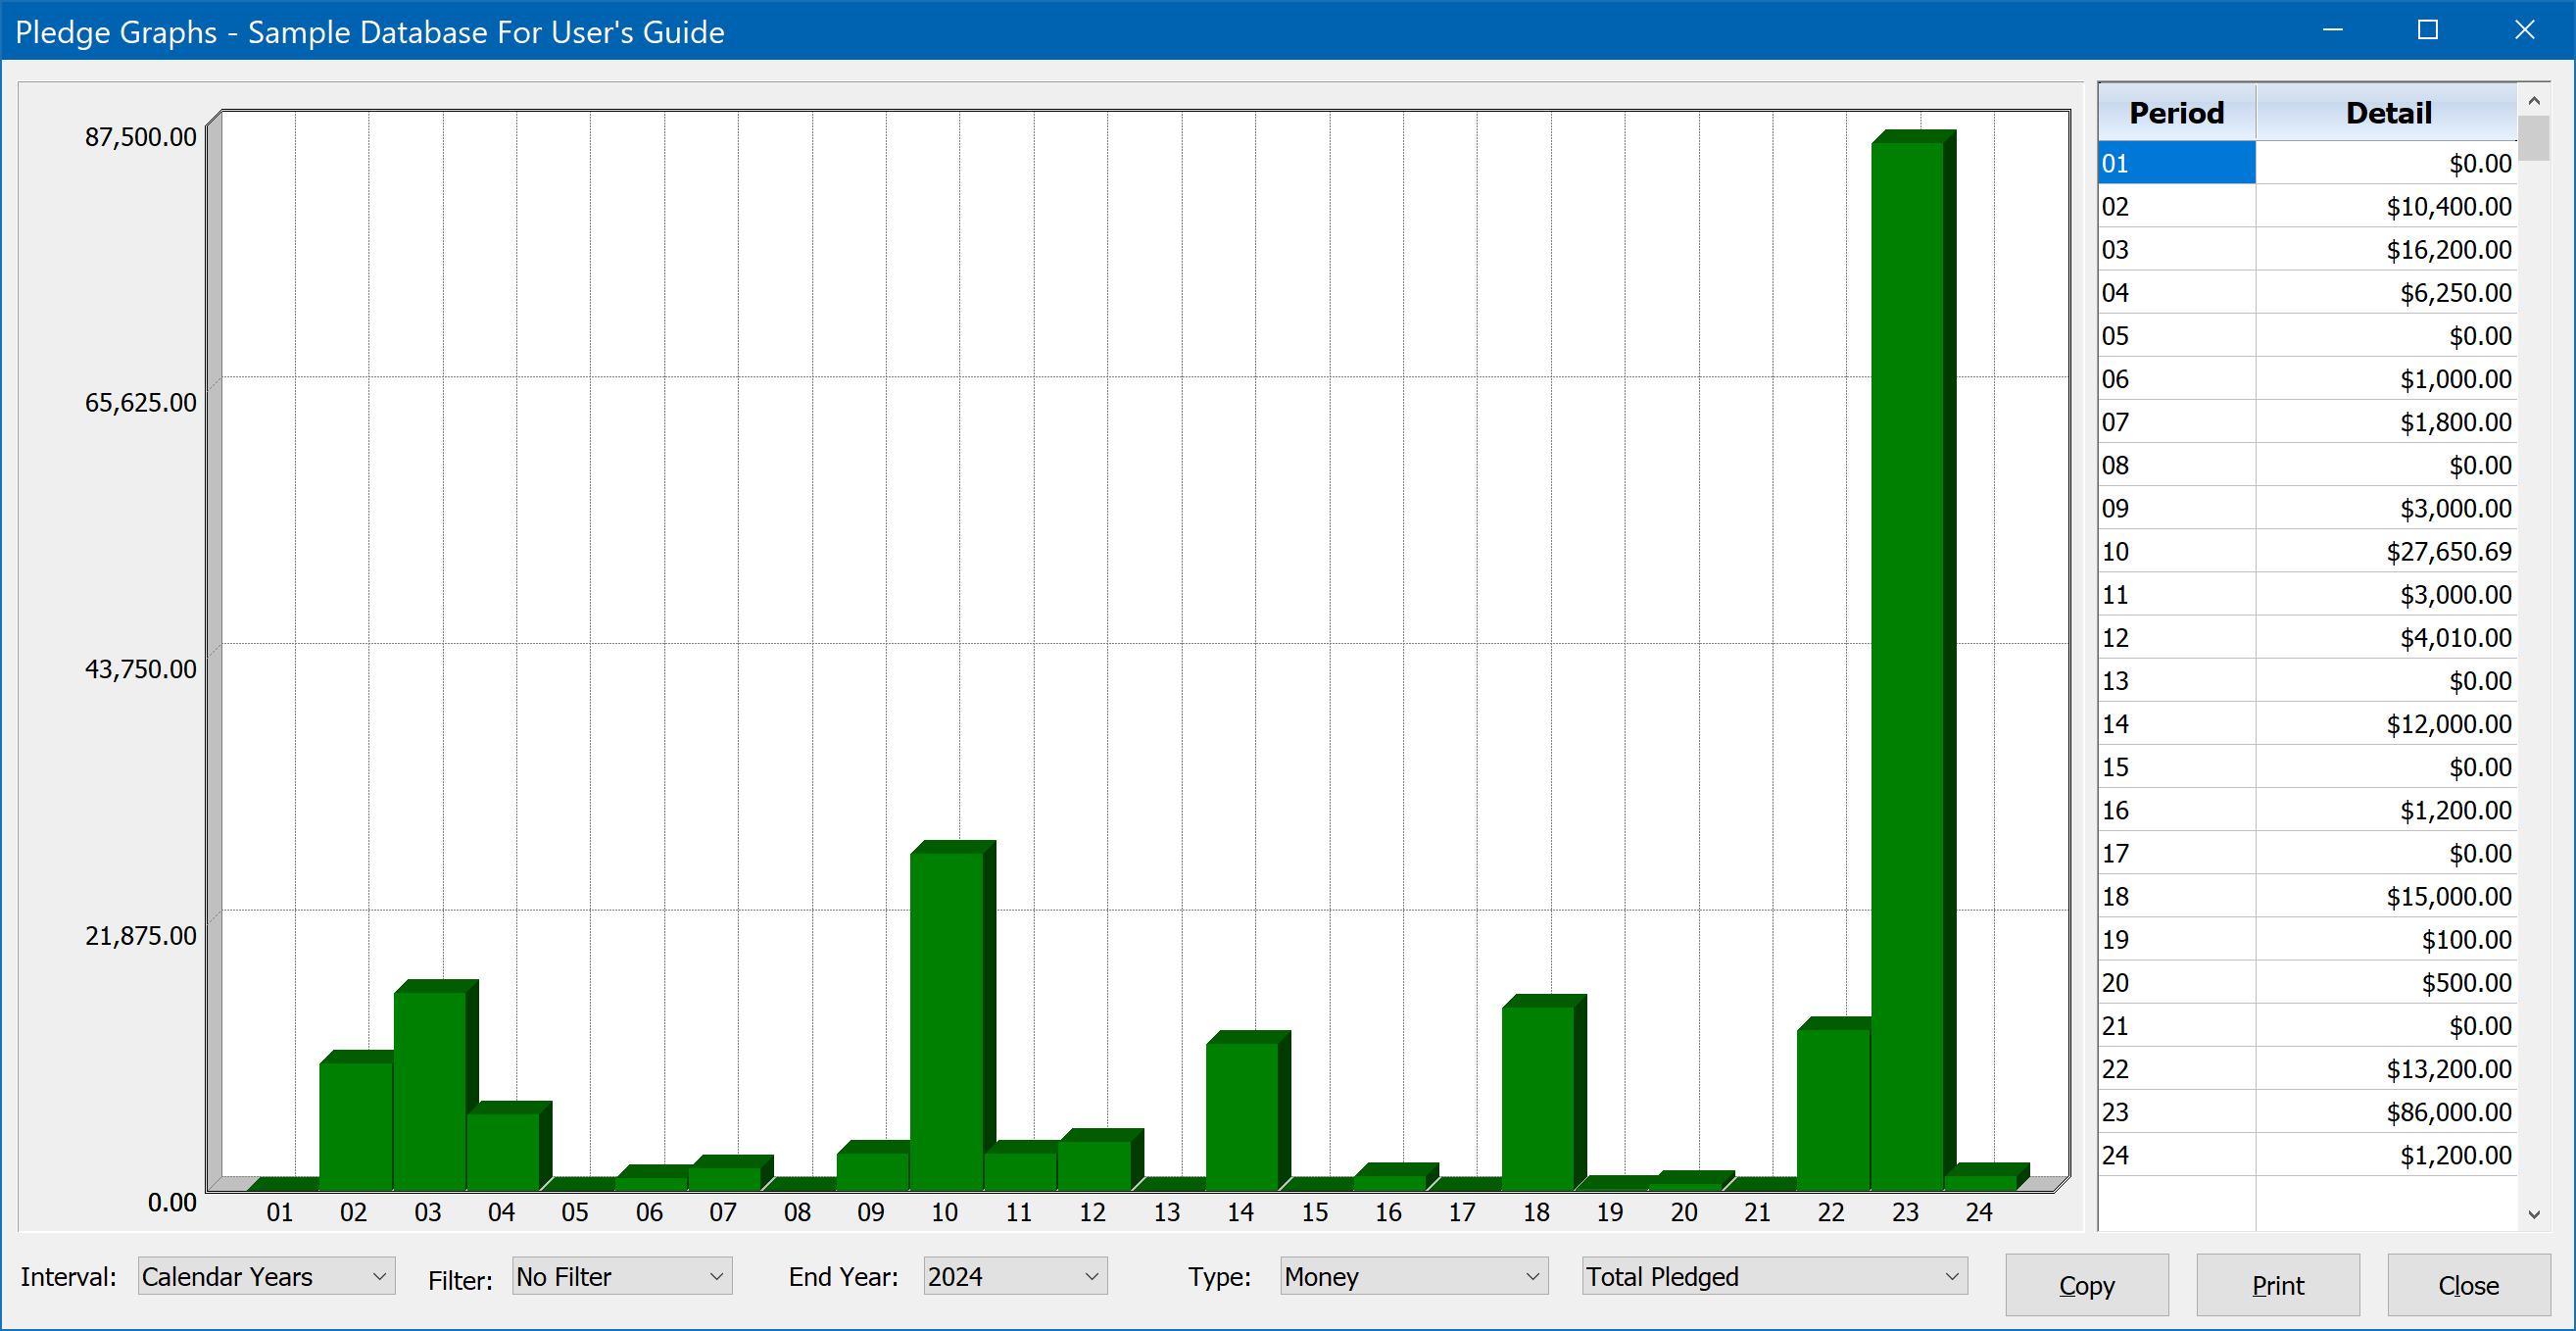
As with all graphs, the Pledge Graphs provide Interval, Filter, and End Year / End Date controls (described above under the Constituent Counts graph). When first opened, the graph will show the default display of a 24-year time span, with total pledged amounts broken down by calendar years. You can change the interval to be fiscal years, months, weeks, or days. When viewing a year or month interval, the ending year of the graph may be set to any year you wish. For example, if you set the ending year to 2008, and keep the interval at calendar years, the graph would cover the years 1984-2008. If the interval is set to weeks or days, you can set an exact ending date.
The pledge graphs may also be driven by a pledge-based selection result. This allows you to filter the pledges included by any conceivable condition or set of conditions. To graph a pledge-based selection result (one built from the pledges table), open the Selection Results window, highlight the pledge-based result you wish to graph, then click on Selections, Pledge Graphs From. Alternatively you may also simply click on the Graph button on the left side of the Selection Results window.
Type
In addition to monetary totals, using the Type control you may also choose from any Alternate Unit types your organization may have created. Alternate Unit donations and pledges are non-monetary. Typical Alternate Unit types of pledges would include hours of time promised from volunteers, pounds of food promised from food processing centers, etc. New Alternate Unit types can be defined as needed under Configure, Program Settings. Donations and Pledges share the same list of defined Alternate Unit Types. The Type filter also has a second drop-down which allows the following additional filters and focus values:
Total Pledged
This is the default when the pledge graph is first opened. It directs the graph to focus on the Pledge Amount field as the subject of the graph. So total amount pledged in each interval is represented in the vertical bars of the graph. Pledges are assigned to Intervals based on their Start Date.
Total Paid
Choosing the Total Paid option directs the graph to focus on how much of each pledge has been paid to date, for pledges with a Start Date in the selected Interval. This total will lag behind the Total Pledged as pledges mature to their full term, but will eventually catch up as time goes by. Note that this is the total paid to date - not the total paid in each time interval (use the Interval Payments Received option instead if that is what you want to see). The Total Paid graph is meant to be compared with the Total Pledged graph to see how much has been paid on the very same pledges which were placed in a specific interval on the Total Pledged graph, based on the Start Date for each pledge.
Remaining Balance
Choosing the Remaining Balance option directs the graph to focus on how much of each pledge remains to be paid to date, for pledges with a Start Date in the selected Interval. This total will approach zero as pledges mature to their full term. Note that this is the remaining balance to date - not the remaining balance in each time interval. It is meant to be compared with the Total Pledged graph to see how much has yet to be paid on the very same pledges which were placed in specific intervals on the Total Pledged graph, based on the Start Date for each pledge.
Interval Payments Expected
Choosing the Interval Payments Expected option will show how much revenue is expected in total for all pledges in each Interval, based on the payment schedule for each pledge. Pledges are assigned to Intervals based on their Start Date.
Interval Payments Received
Choosing the Interval Payments Received option will show how much revenue was actually received in total for all pledges, but just within each Interval. Pledges are assigned to Intervals based on their Start Date. Comparing this against the Interval Payments Expected graph will reveal how behind in payments your donors were in total for each Interval, though some may have, "caught up" on payments in later intervals. This does not show total payments to date - use the Total Paid option for this.
IPE Counts
Interval Payments Expected Counts. This simply displays a count of the number of pledges with payments expected in each Interval.
IPR Counts
Interval Payments Received Counts. This simply displays a count of the number of pledges with payments actually received in each Interval.
Pledge Counts
This is simply a count of the number of pledges with a Start Date in each Interval.
Memo Counts
Choosing Reports, Graphs, Memo Graphs will open with the Memo When Added Counts graph, which looks like this:
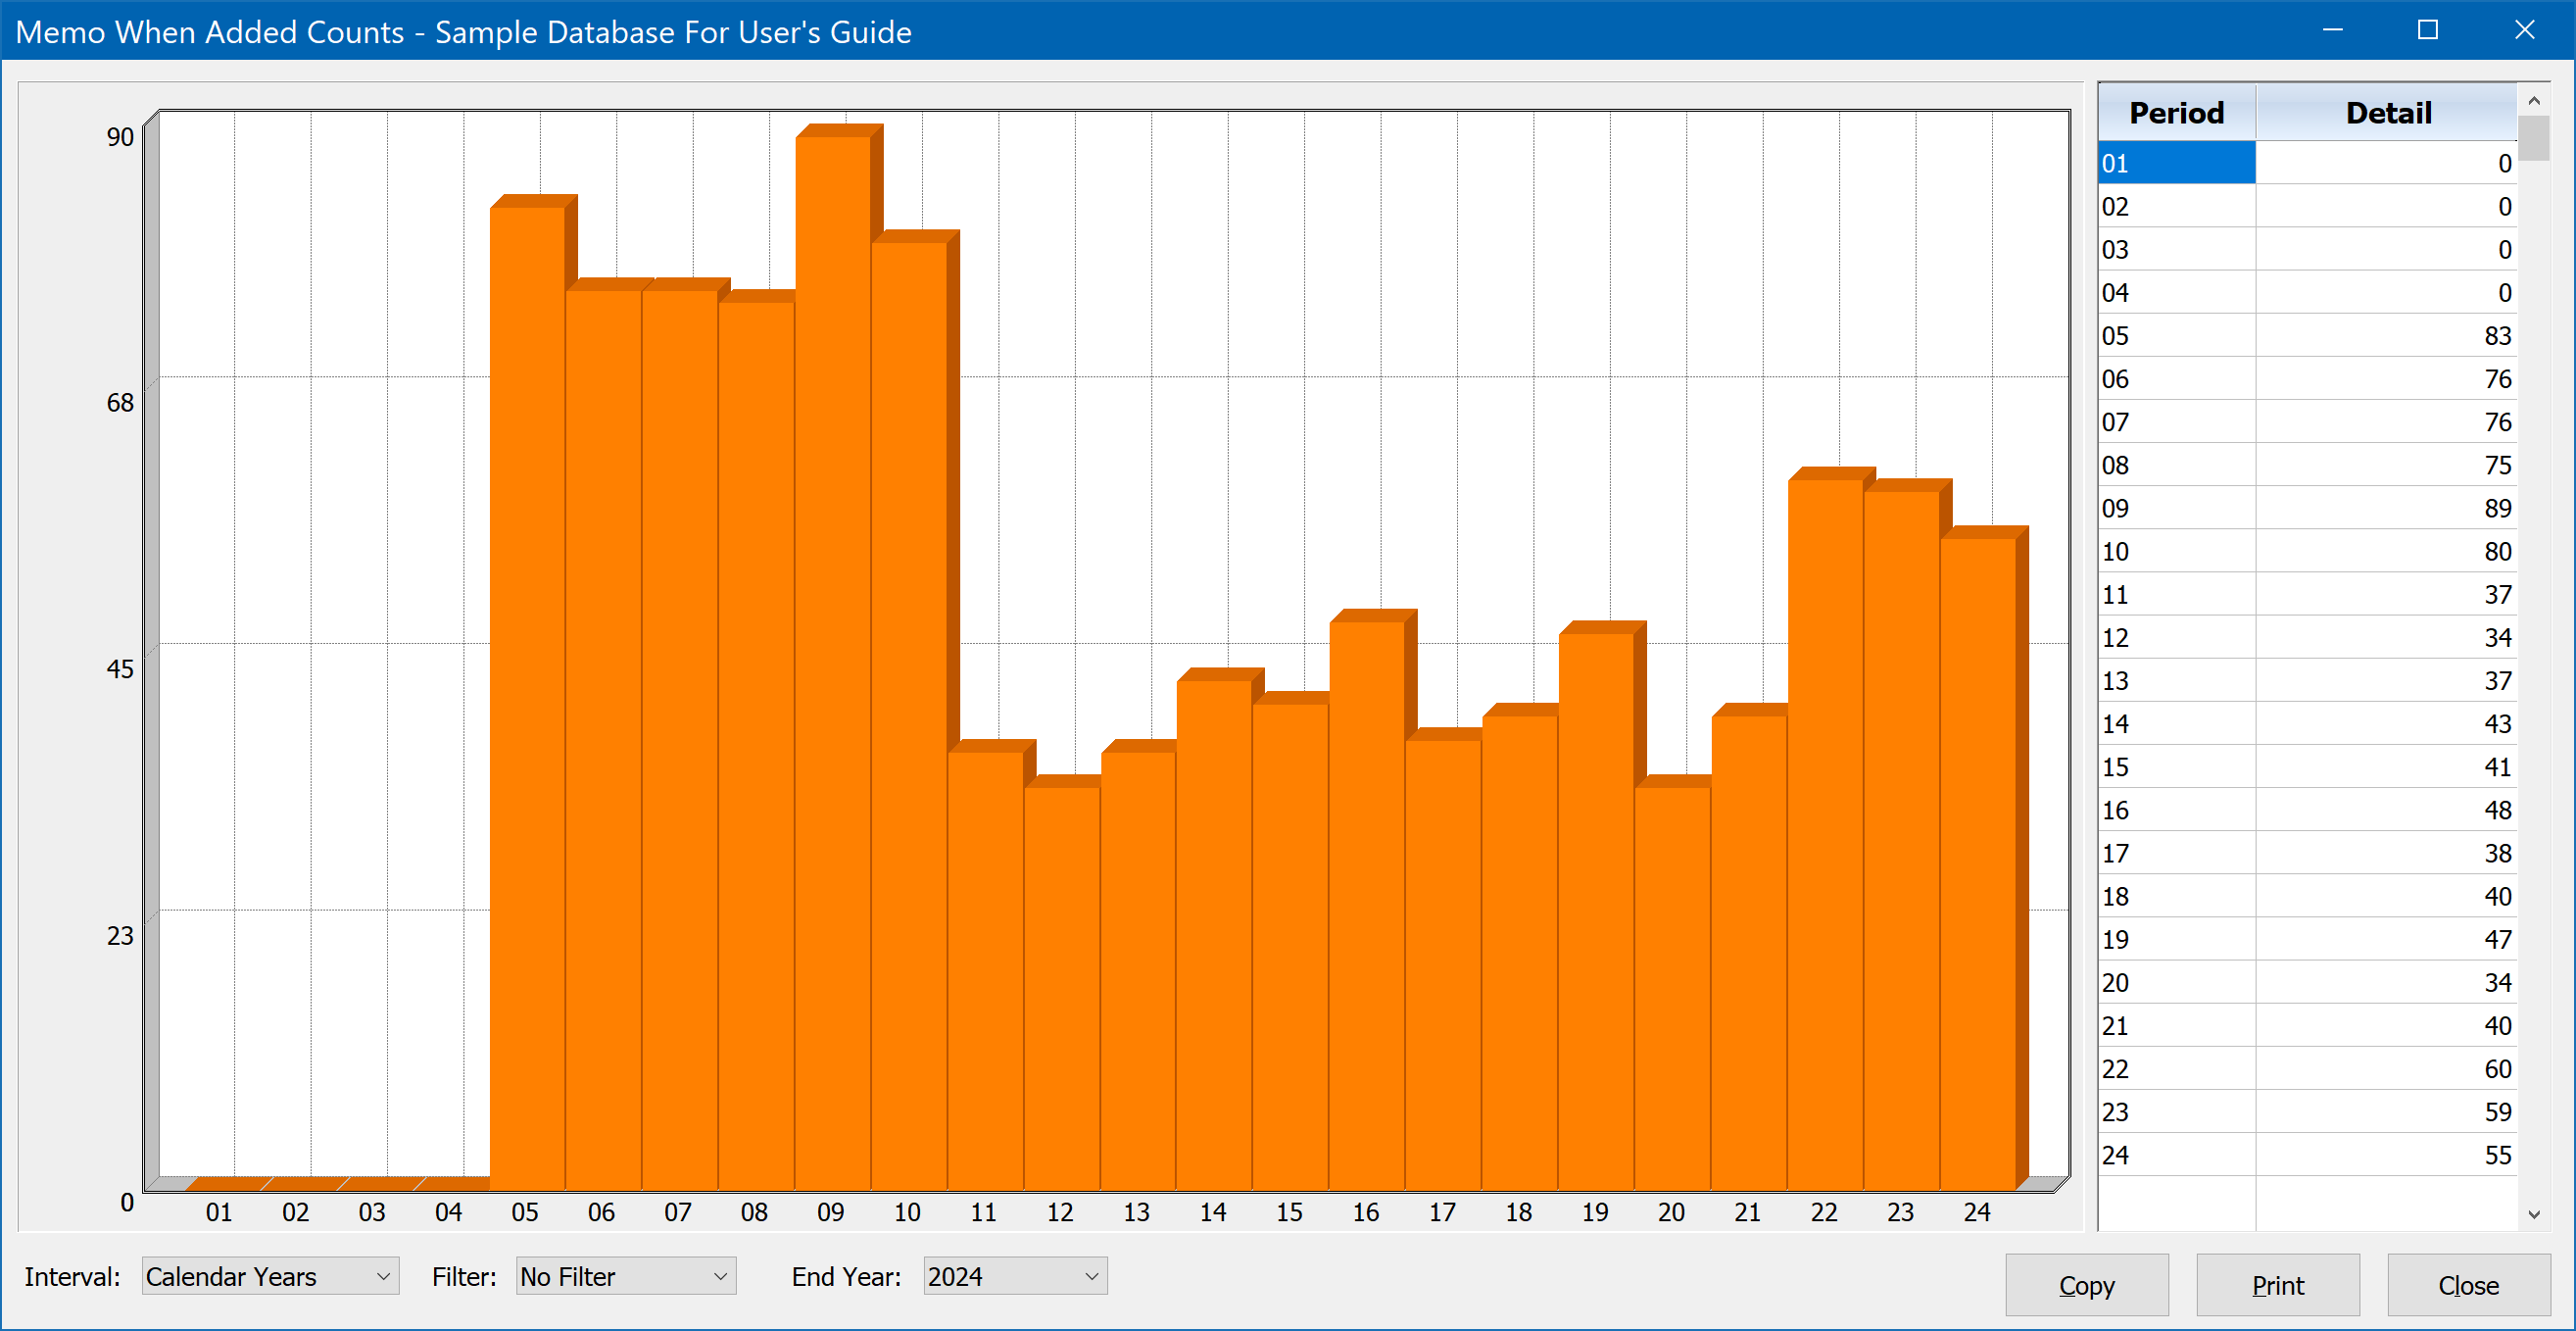
As with all graphs, the Memo When Added Graphs provide Interval, Filter, and End Year / End Date controls (described above under Constituent Counts graph). When first opened, the graph will show the default display of a 24-year time span, with total memos added counts broken down by calendar years. You can change the interval to be calendar years, fiscal years, months, weeks, or days. When viewing a year or month interval, the ending year of the graph may be set to any year you wish. If the interval is set to weeks or days, you can set an exact ending date.
Memos are convenient for making short notes about key interests or attributes of a donor’s profile. As with donations and pledges, each donor may have an unlimited number of memos. The above example graph is from a sample database with a small number of donors. In practice, the memo's added each year would be in the thousands, depending on how many donor's (constituents) an organization has, and how extensively they are using the memo feature. The main purpose of this graph is simply to give you a visual representation of how extensively your organization is using the Memo feature. However, if your organization is using the Memos feature to track things such as which solicitations each donor has received, then when combined with a memo-based selection result, this graph will reveal your solicitation volume over time. For more information on Memos, please refer to the Quick Start Guide topic here, and the Entering Information topic here.
The Memo Counts graphs may also be driven by a memo-based selection result. This allows you to filter the memos included by any conceivable condition or set of conditions. To graph a memo-based selection result (one built from the memos table), open the Selection Results window, highlight the memo result you wish to graph, then click on Selections, Memo Graphs From. Alternatively you may also simply click on the Graph button on the left side of the Selection Results window.
Scheduled Contact Graphs
Choosing Reports, Graphs, Scheduled Contact Graphs will open with the standard year-based Scheduled Contacts graph. Typically, you will be interested in seeing more recent contact information, so you will set the Interval to Months, which looks like this:
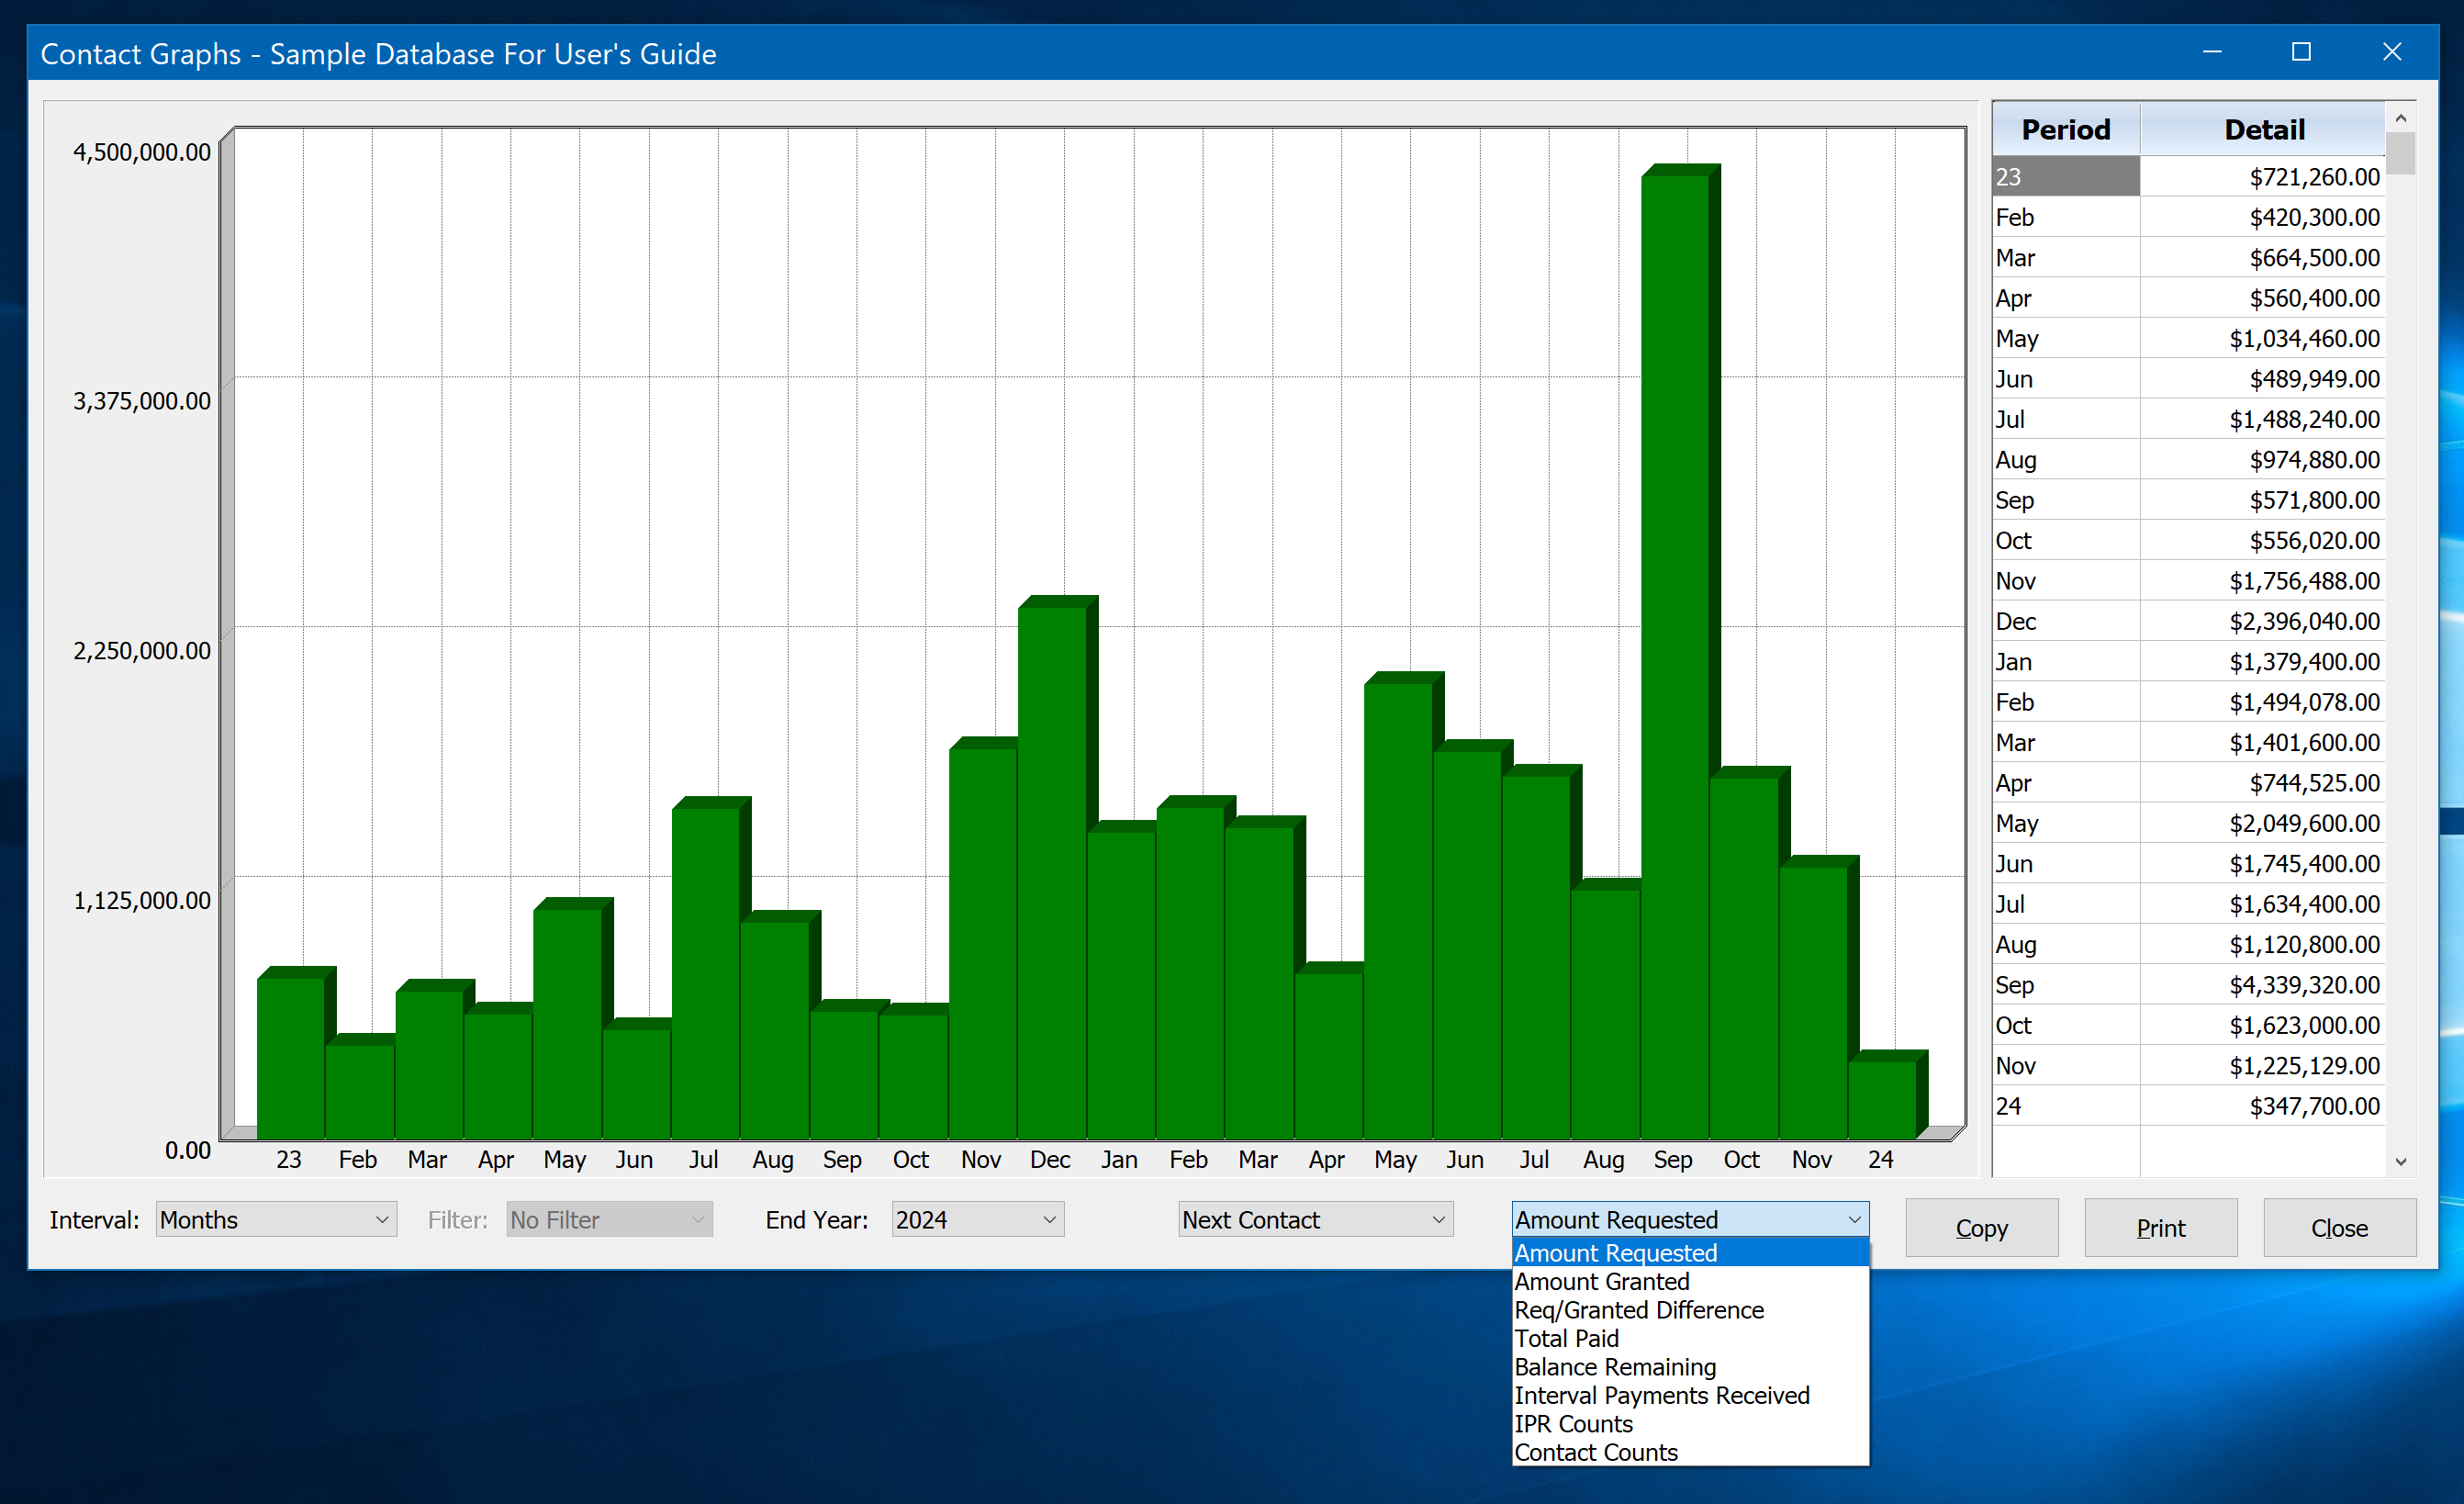
As with all graphs, the Contact Graphs provide Interval, Filter, and End Year / End Date controls (described further above under the Constituent Counts graph topic). The Contacts Graphs mostly focus on the Grant Management feature of Contacts. When first opened, the graph will show the default display of a 24-year time span for when grant requests have been made, with the total grant amount requested segmented by calendar years and displayed in the height of the bars. The above example focuses on the total amount of grant requests by month, over the past 24 months.
Grants are large donations typically made by corporations and foundations. But they usually take some work to get -- and a lot of follow-up with corporate and foundation contacts. That's why Grant Management fields are a perfect fit for the contact manager in DonorQuest. The contact manager has a group of fields specifically dedicated to acquiring and fulfilling a grant. For more background information on the DonorQuest Contact Manager in general, and the Grant Management Component in particular, please refer to the contact topics in the Quick Start Guide here, and the Entering Information topic here.
In addition to the basic Interval, Filter, and End Year / End Date controls, the Contact Graphs have two additional controls for choosing which date field of a contact record is used on the time axis, and which amount field is used to set the height of the bars. The available contact date fields you may choose from for the time axis are Last Contact, Next Contact, Request Made, Request Acknowledged, Decision Made, First Payment, and When Added. The available contact amount fields you may choose from for building the height of the bars are Amount Requested, Amount Granted, Requested/Granted Difference, Total Paid, Balance Remaining, Interval Payments Received, Interval Payments Received Counts, and Contact Counts. Following is a brief description of each of these options:
Last Contact
This is the date when the user assigned to the contact last interacted with the donor regarding the contact. Since there may be several interactions with a donor regarding a specific contact before the contact is finally closed, both this date and the Next Contact date (described below) may be reset several times. The last contact date shows at a glance how long it has been since the donor was last contacted concerning the specific issue for which the contact was created.
Next Contact
This is the trigger date for the next action to be taken with the contact. When the user designated for a specific contact logs into DonorQuest on or after this date, the contact will be included in the reminder which shows the user how many open contacts they now have that have come due for action. The login reminder will continue to include a contact until the contact is closed, or the contact date is changed to again be in the future.
Request Made
This is the date that the corporation or foundation from which you are seeking a grant was first contacted by your organization with a grant proposal.
Request Acknowledged
This is the date the corporation or foundation from which you are seeking a grant first responded to your request.
Decision Made
This is the date the corporation or foundation from which you are seeking a grant made a decision regarding the grant.
First Payment
When a grant is given, this is the date when the first grant payment is expected.
When Added
The date the contact record was created.
Amount Requested
This is the amount you are asking for in the grant.
Amount Granted
This is the amount the corporation or foundation decided to fund.
Requested/Granted Difference
This is a computed value equal to the grant amount requested, minus the amount granted. When graphing this, you want to see the values on the vertical graph axis be very small, meaning your organization is getting most or all of the amounts they are asking for in grants. Further, if this graph is consistently minimal or even zero across the board, you might consider increasing the asking amounts for your grant requests.
Total Paid
This is a running total which DonorQuest will automatically update for you. Sometimes grants will be funded in one lump sum, other times they will be funded in payments over time. In both cases, grant revenue should be recorded as donations in DonorQuest. A connection is made between donations and grants via the Donation Stimulus and Grant Donation Payment link fields, which share the same drop-down list of Stimulus codes. Graphing this value will show you total revenues from all your grants in the time Interval you have chosen. Note that all payments to each grant are included, regardless of when they were made. So it's a total paid-to-date for each grant, no matter where on the timeline the grant itself was created.
Balance Remaining
This will produce a graph of the difference between the amounts granted and what has been paid so far in the chosen time interval. Extending the time interval well into the past will allow you to easily spot if there are any grants which were not paid completely.
Interval Payments Received
This is a total of the payments for each grant received within each time interval. For example, if you have chosen years for the time interval, the vertical bar for each year would represent the total payments to each grant for just that year. This is different than the Total Paid option, which graphs the total of all payments to (today's) date for each grant.
Interval Payments Received Counts
This is a count of the payments for each grant received within each time interval. For example, if you have chosen years for the time interval, the vertical bar for each year would represent a count of the total payments to each grant for just that year.
Contact Counts
This is just a simple count of the number of contacts in each segment of the time interval you have chosen to graph.
Donor Retention Graphs
Choosing Reports, Graphs, Donor Retention Graphs will open the Donor retention graph, which looks like this:
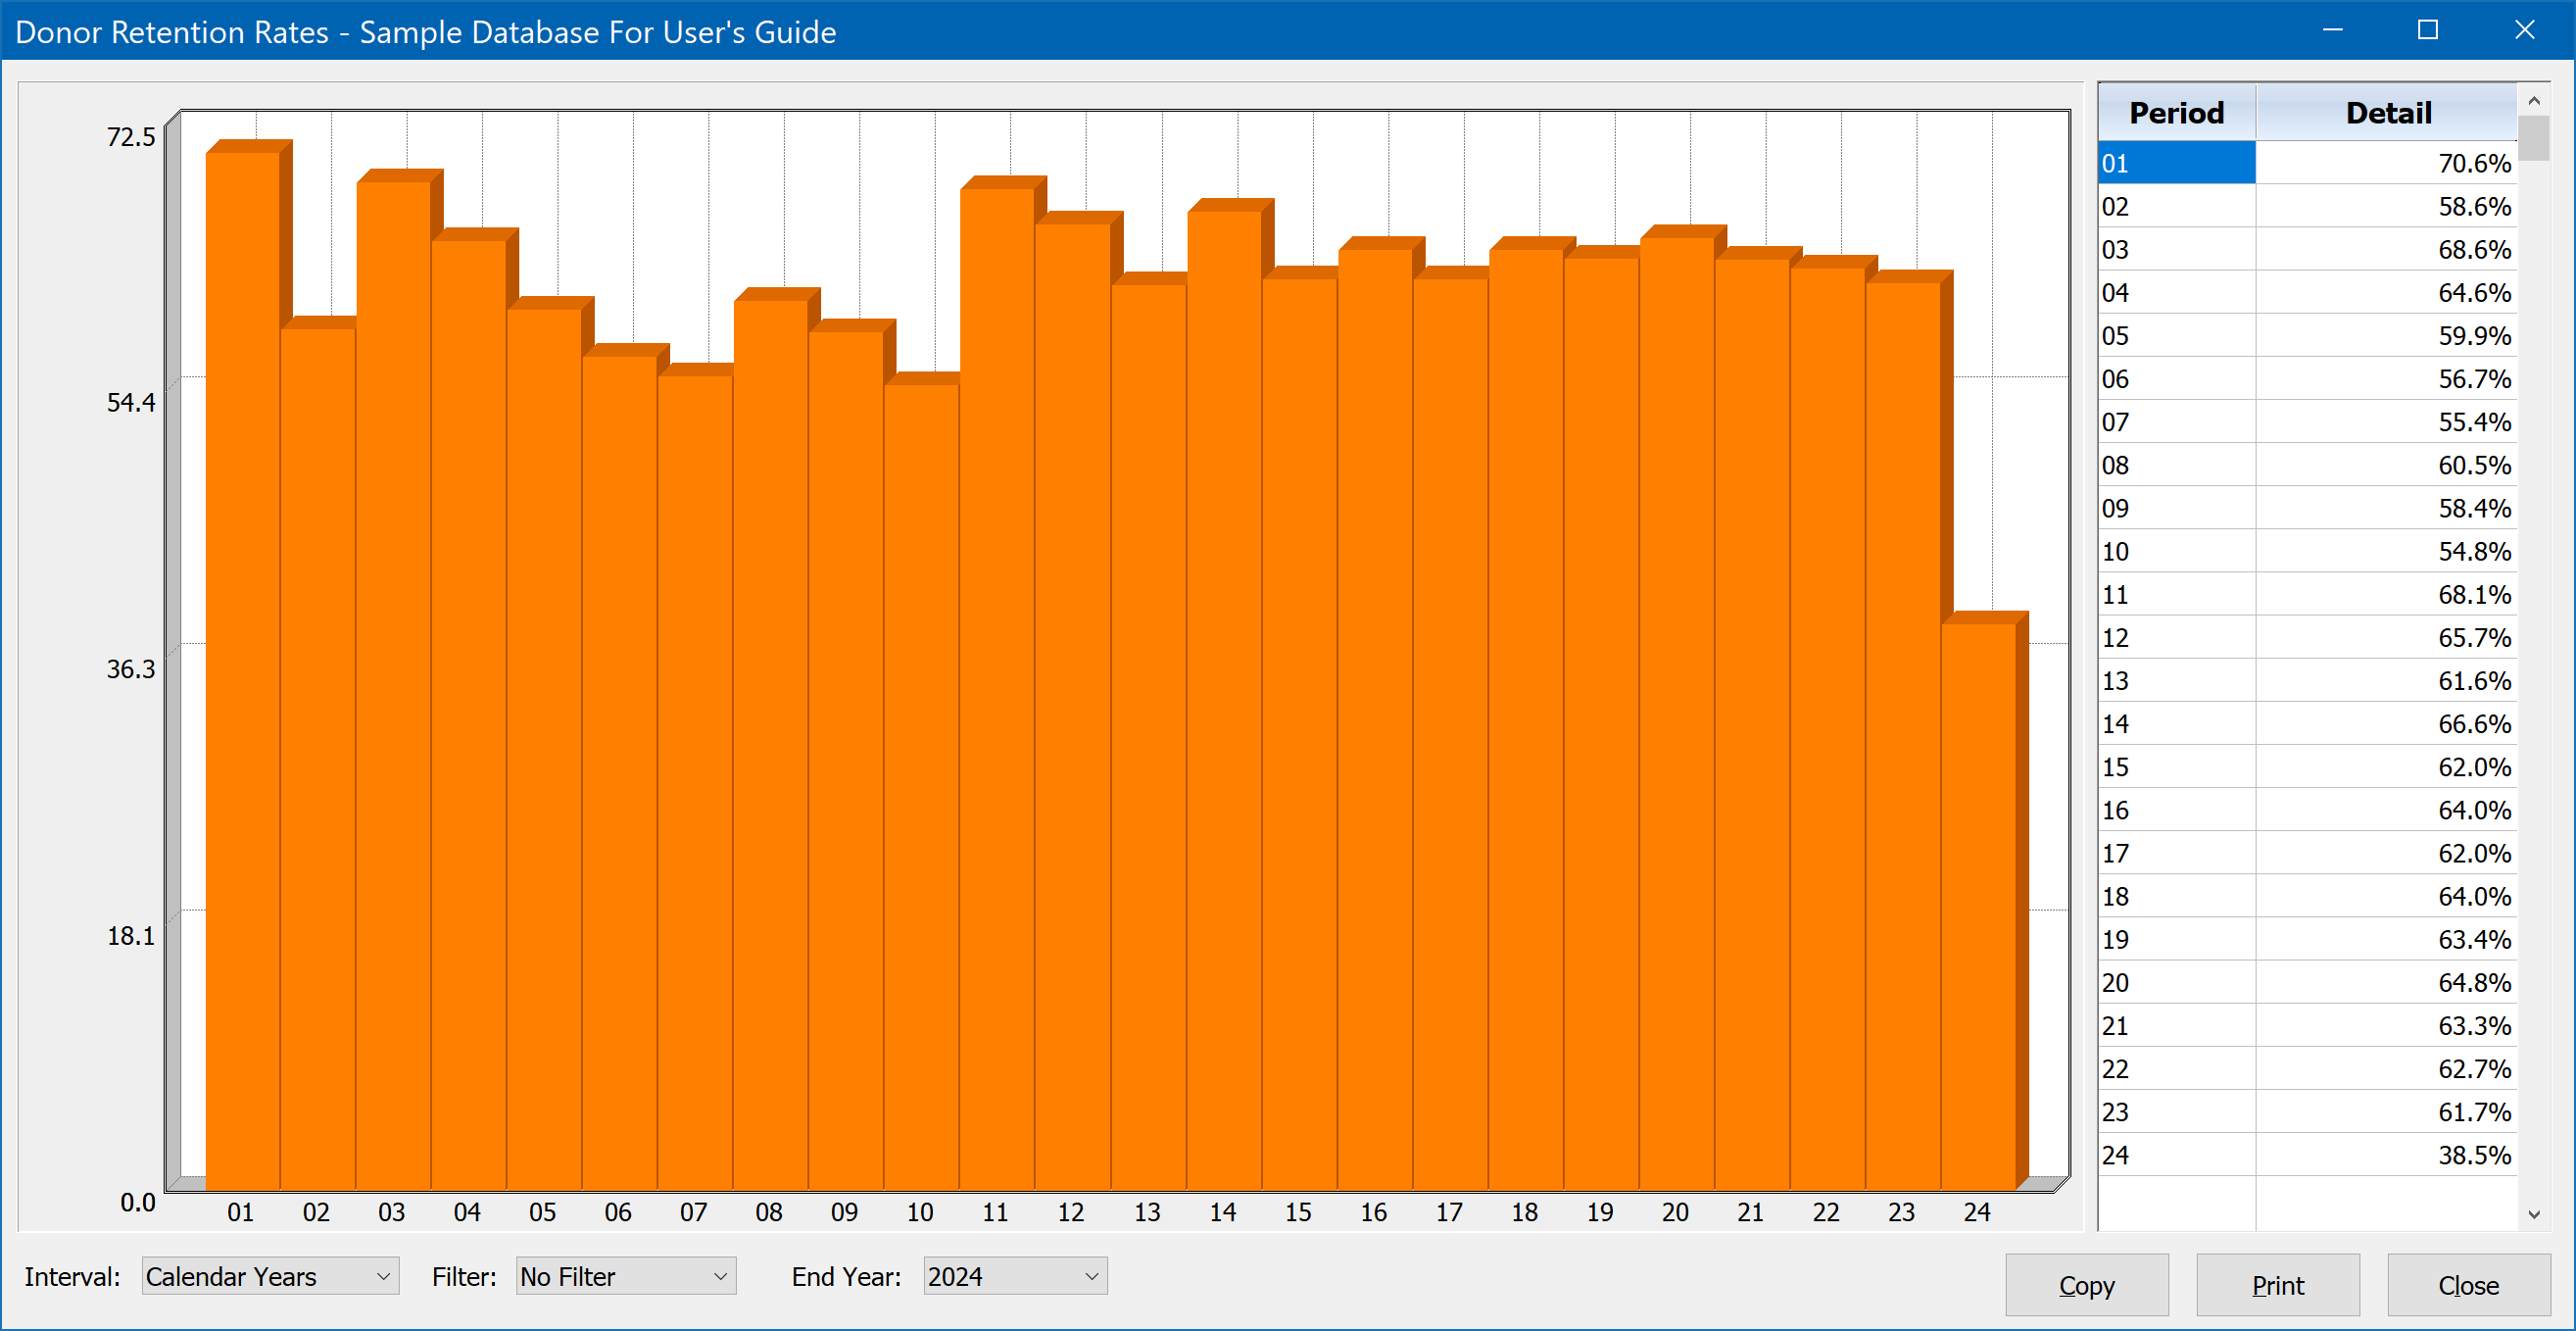
The Donor Retention graph allows you to visualize your donor retention rates over time, usually from year-to-year. A retained donor is someone who gave in two consecutive intervals on the chosen time line. Most nonprofit organizations average a yearly retention rate of about 45 percent. As with all graphs, the Donor Retention Rates graph provides Interval, Filter, and End Year controls (described further above under the Constituent Counts graph topic). However, intervals for this graph are limited to Calendar Years, Fiscal Years, and Months.